Lecture 12: Feature importances
Announcements
Motivating Feature importances
In the next few slides, consider the two scenarios and decide which model you would pick given the circumstances described.
Scenario 1: Which model would you pick?
Predicting whether a patient is likely to develop diabetes based on features such as age, blood pressure, glucose levels, and BMI. You have two models:
- LGBM which results in 0.9 f1 score
- Logistic regression which results in 0.84 f1 score
Which model would you pick? Why?
Scenario 1: Which model would you pick?
Predicting whether a user will purchase a product next based on their browsing history, previous purchases, and click behavior. You have two models:
- LGBM which results in 0.9 F1 score
- Logistic regression which results in 0.84 F1 score
Which model would you pick? Why?
Transparency
- In many domains understanding the relationship between features and predictions is critical for trust and regulatory compliance.
Feature importances
- How does the output depend upon the input?
- How do the predictions change as a function of a particular feature?
How to get feature importances?
Correlations
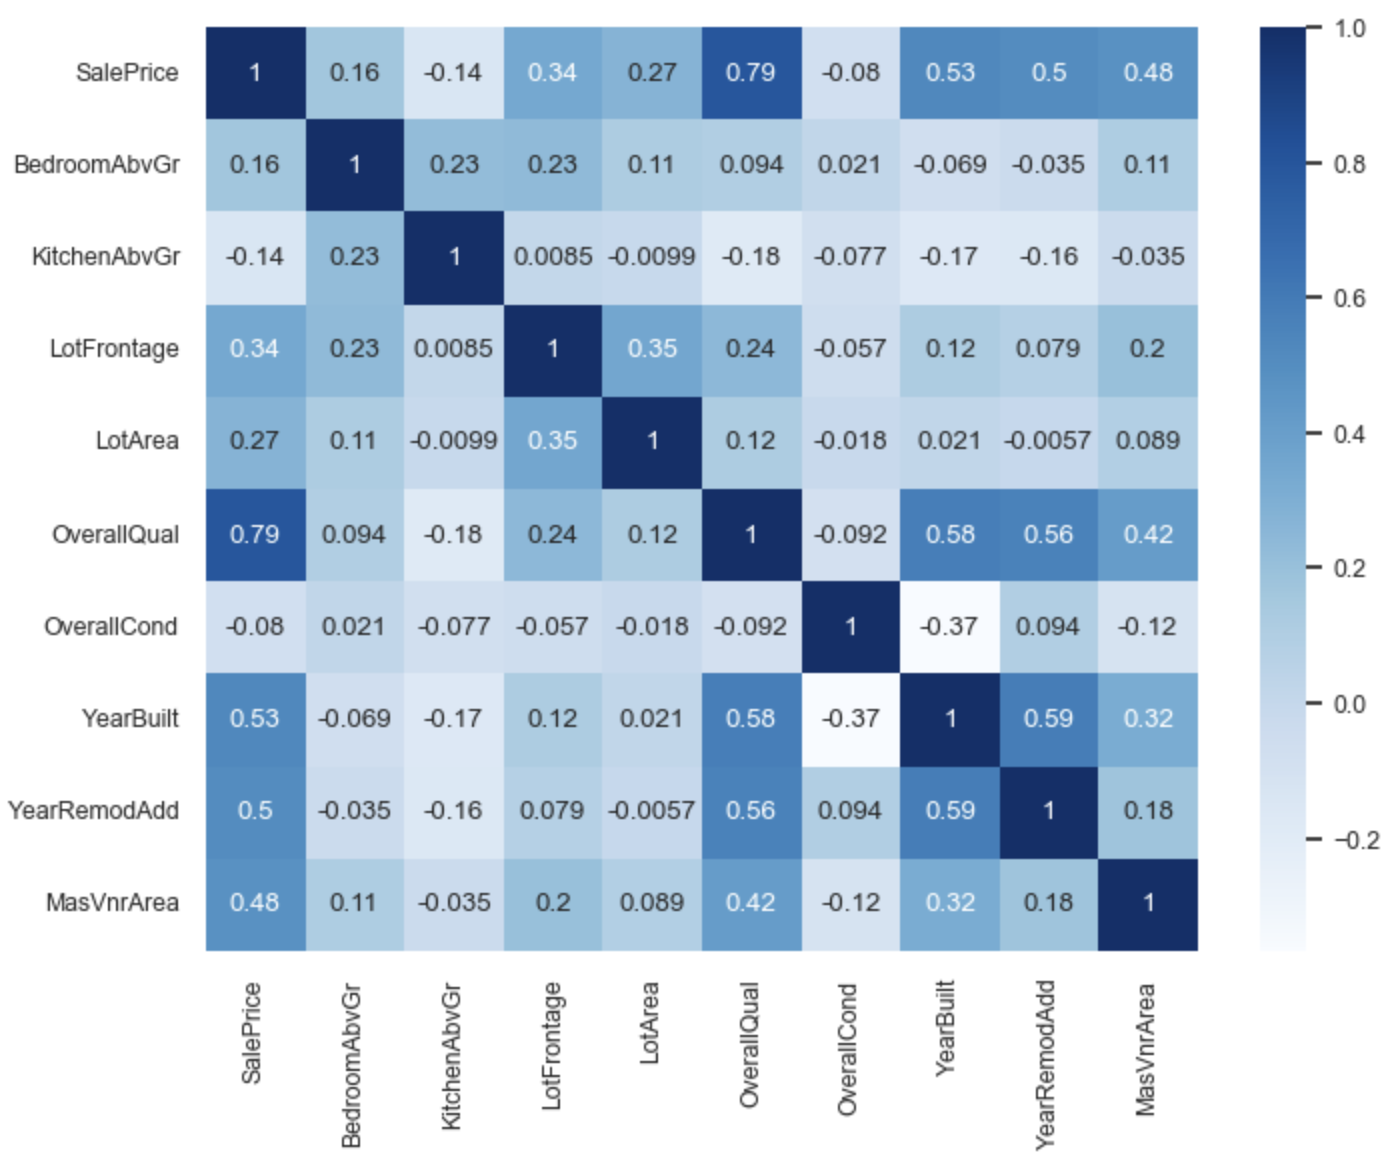
- What are some limitations of correlations?
Interpreting coefficients
- Linear models are interpretable because you get coefficients associated with different features.
- Each coefficient represents the estimated impact of a feature on the target variable, assuming all other features are held constant.
- In a
Ridgemodel,- A positive coefficient indicates that as the feature’s value increases, the predicted value also increases.
- A negative coefficient indicates that an increase in the feature’s value leads to a decrease in the predicted value.
- A positive coefficient indicates that as the feature’s value increases, the predicted value also increases.
Interpreting coefficients
- When we have different types of preprocessed features, what challenges you might face in interpreting them?
- Ordinally encoded features
- One-hot encoded features
- Scaled numeric features
Break
Let’s take a break!

Pause and Reflect
We are now just over half-way through CPSC 330!
You had a midterm already a couple of weeks ago, I’d like some feedback on how things are going in class (as the instructor).
Class Survey
I’d love to hear how you think lectures are going, and how the course is going overall: bit.ly/cpsc330_2026W1.
Let’s take a couple of minutes to complete this before we get started on today’s content.
Group Work: Class Demo & Live Coding
For this demo, each student should click this link to create a new repo in their accounts, then clone that repo locally to follow along with the demo from today.
Finishing up Feature importances and motivating SHAP
Why do we care about feature importances so much?
- Identify features that are not useful and maybe remove them.
- Get guidance on what new data to collect.
- New features related to useful features -> better results.
- Don’t bother collecting useless features -> save resources.
Finishing up Feature importances
- Help explain why the model is making certain predictions.
- Debugging, if the model is behaving strangely.
- Regulatory requirements.
- Fairness / bias. See this.
- Keep in mind this can be used on deployment predictions!
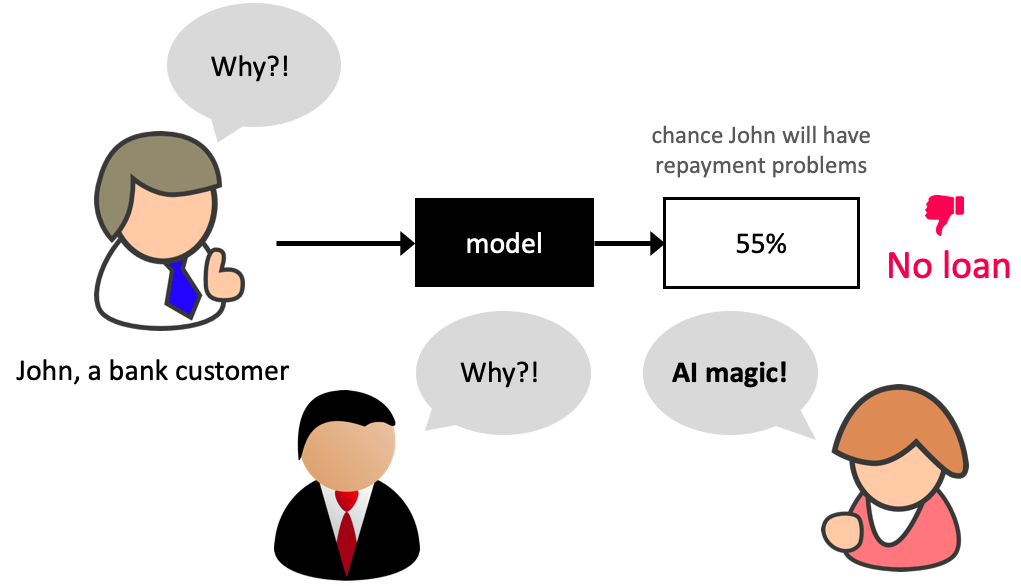
Why bother about model transparancey?
SHAP
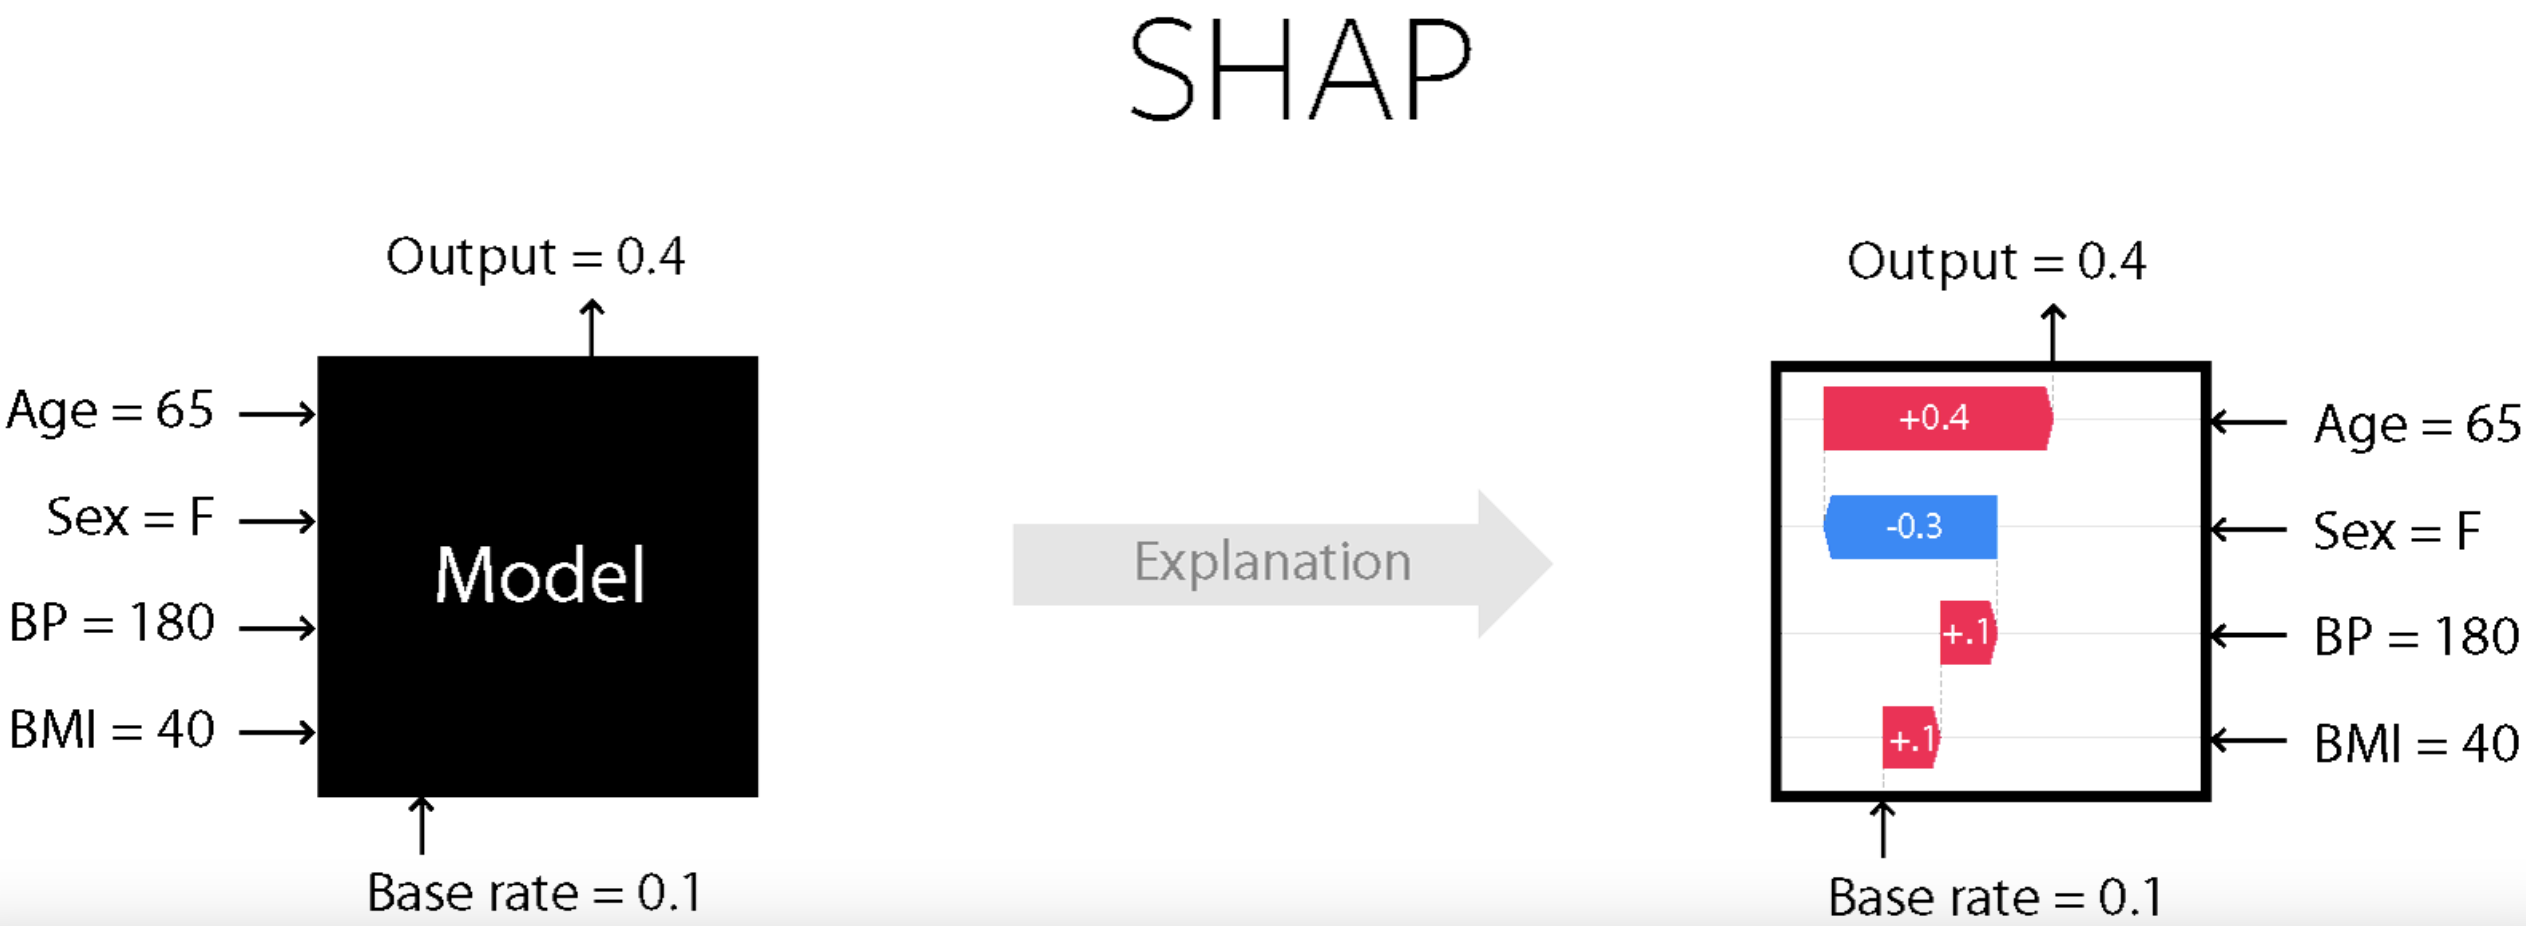
SHAP intuition
- Think of the model as a “black box” that outputs predictions.
- SHAP asks: If we treat each feature as a player contributing to the final prediction, how much credit does each one deserve?
- To answer this fairly, SHAP looks at all possible combinations of features and averages their marginal contributions.
- A marginal contribution is how much the prediction changes when you add that feature to a subset of other features.
SHAP
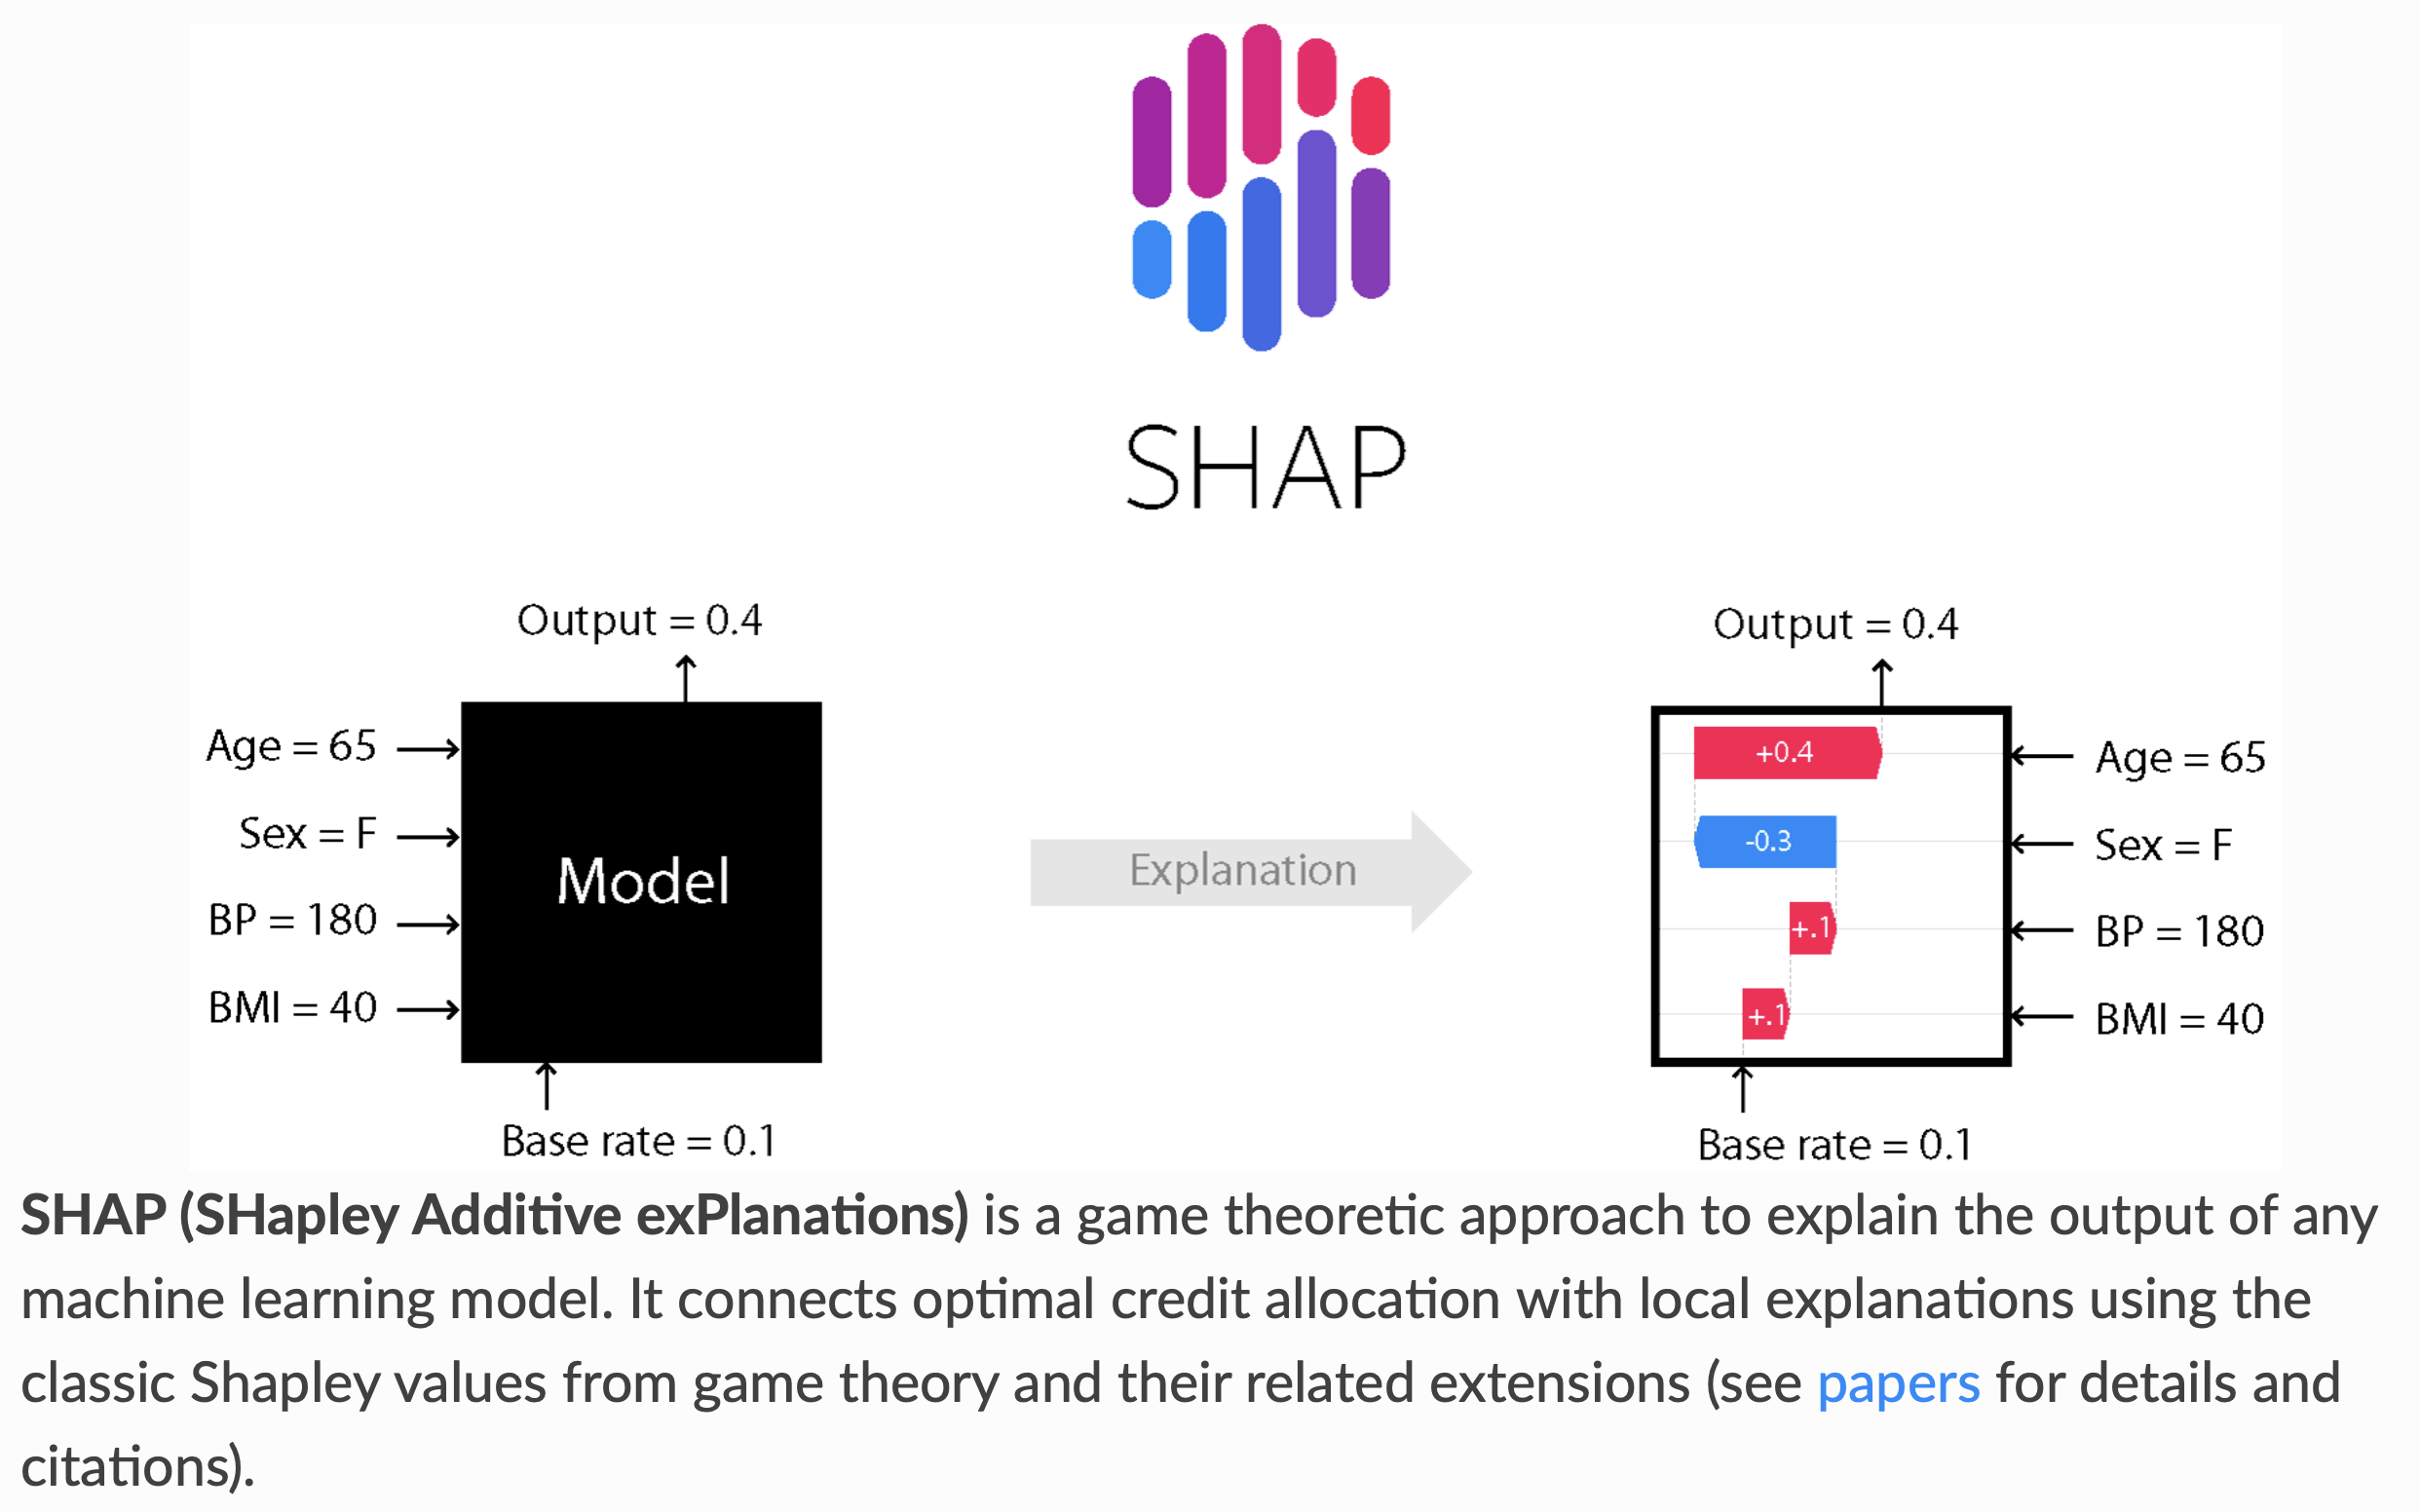
Extending SHAP
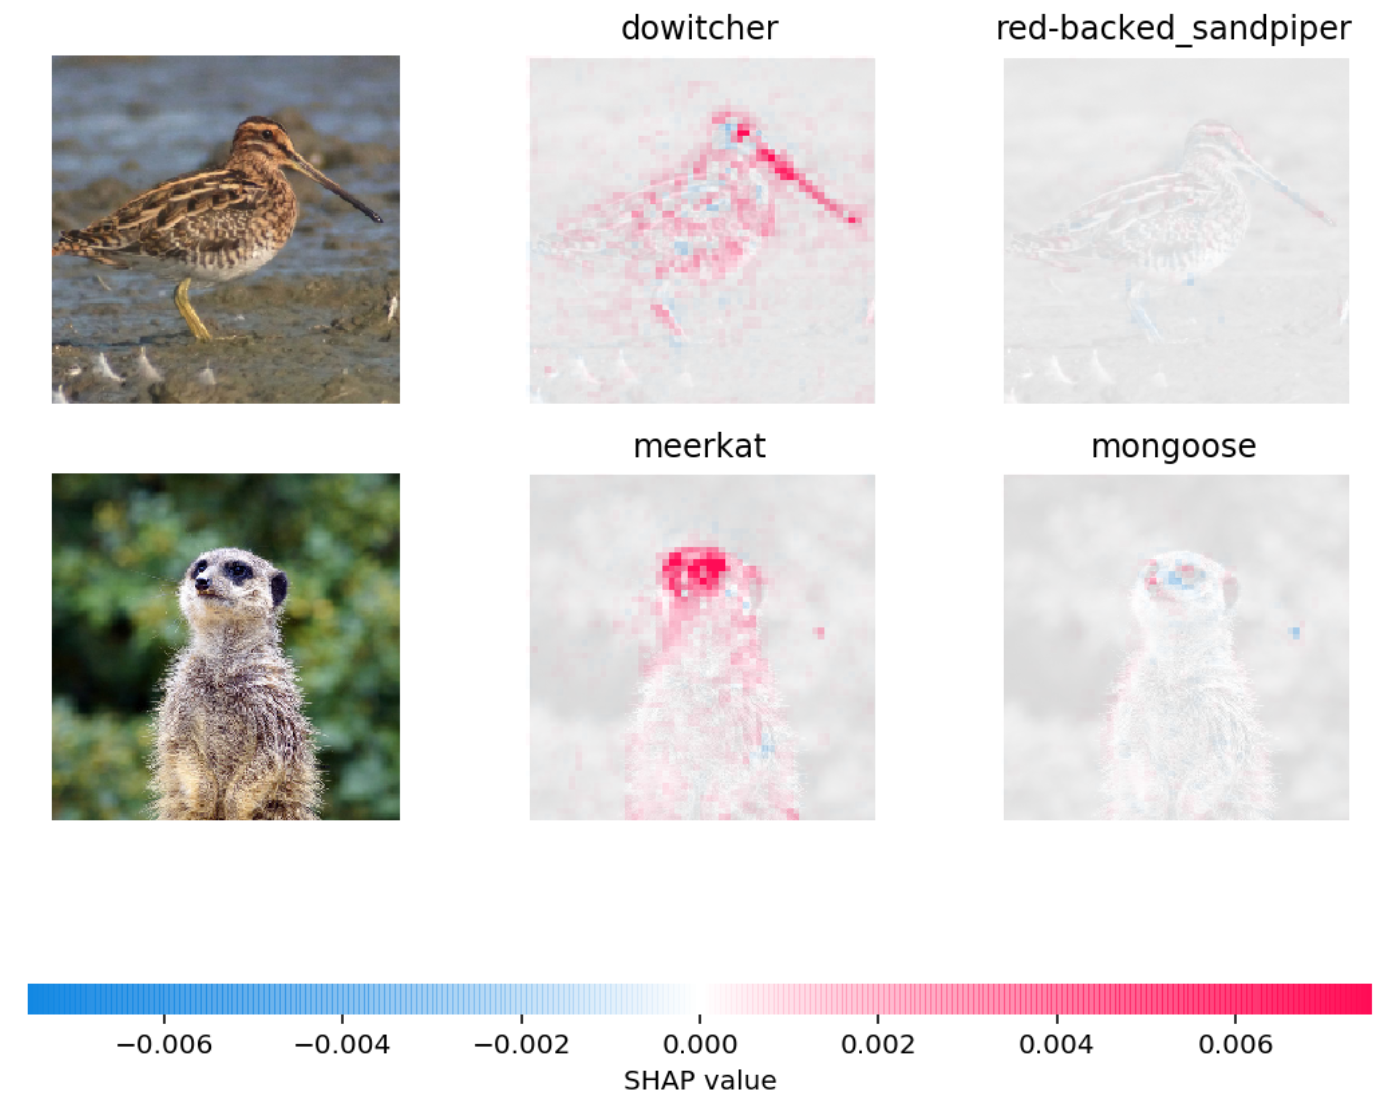
- Can also be used to explain text classification and image classification!
Extending SHAP
Extending SHAP
- Example: In the picture below, red pixels represent positive SHAP values that increase the probability of the class, while blue pixels represent negative SHAP values the reduce the probability of the class.
Practice Question on SHAP
Select all the statements that are true:
- SHAP values are model parameters learned during training.
- Coefficients in a linear model and SHAP values both quantify how much each feature contributes to a prediction, but coefficients are global while SHAP values are local.
- SHAP values can only be computed for tree-based models.
- A waterfall plot shows how each feature’s SHAP value cumulatively contributes to a single prediction.
- SHAP provides the same explanation for all examples in the dataset.